Project Estimation, Done the Right Way
Sometimes, winning the work isn’t the hardest part of your job.
Project estimation continues to be a complex issue for agencies to get a handle on. It’s a delicate balance of setting clear expectations with the client while knowing they’ve got other offers on the table from your competition. You don’t want to dump 10 hours into a well-thought out proposal, only to have it be declined. But if you don’t spend enough time on the fine print, your project scope may get away from you.
In this article we share tips that have helped dozens of agencies make data-driven decisions that only become stronger and more reliable with time.
DOWNLOAD your copy of the definitive agency profitability playbook and make more informed decisions driving the growth of your agency today.
So, how do we do it?
Enter, the Agency Profitability Flywheel.
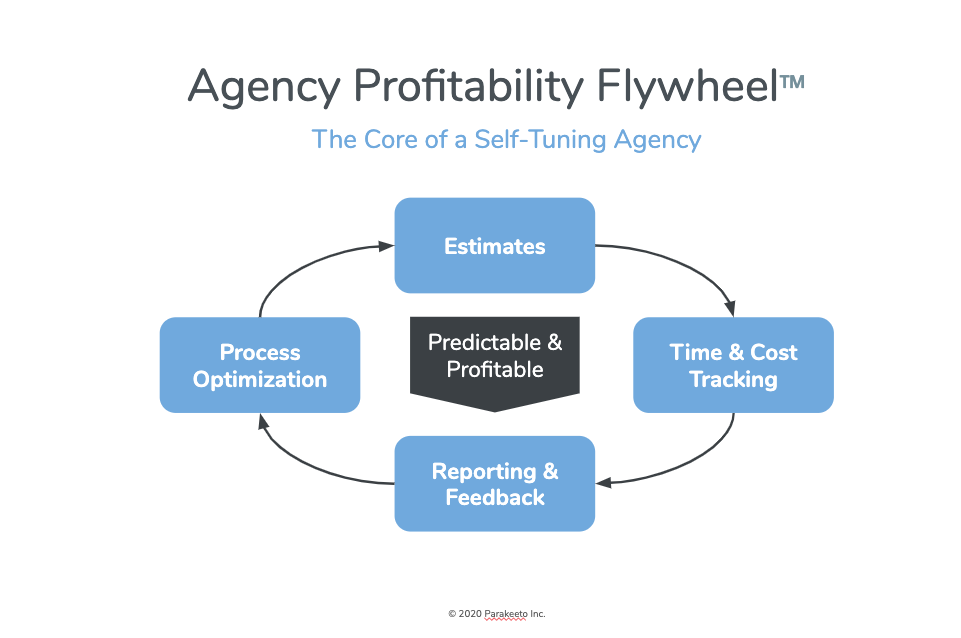
The Agency Profitability Flywheel is a framework that allows your agency to self-tune it’s estimation system in four steps:
- Defining estimation techniques
- Installing quantitative feedback loops (time & cost tracking)
- Establishing reporting & feedback cadences
- Defining process optimization cadences
Steps one and two are focused on getting your estimations out quickly, without compromising on accuracy. Steps three and four focus on actionable feedback from your team, improving profitability, efficiency, and consistency as well as making the work you do more predictable over time through better process.
Step one: defining your estimation technique
First, you’re going to want to standardize the estimation system you have. I know - you have different clients, different types of projects, etc. But, there is still a way to create a template that you use each time you estimate projects for a client.
Let’s start by answering the following question:
What are the assumptions that, if proven inaccurate, could have the largest impact on our profits, project cost, and people? Would it force us to absorb costs or work a lot of overtime?
Usually, it comes back to these two things:
- Identifying your Scoping Metrics
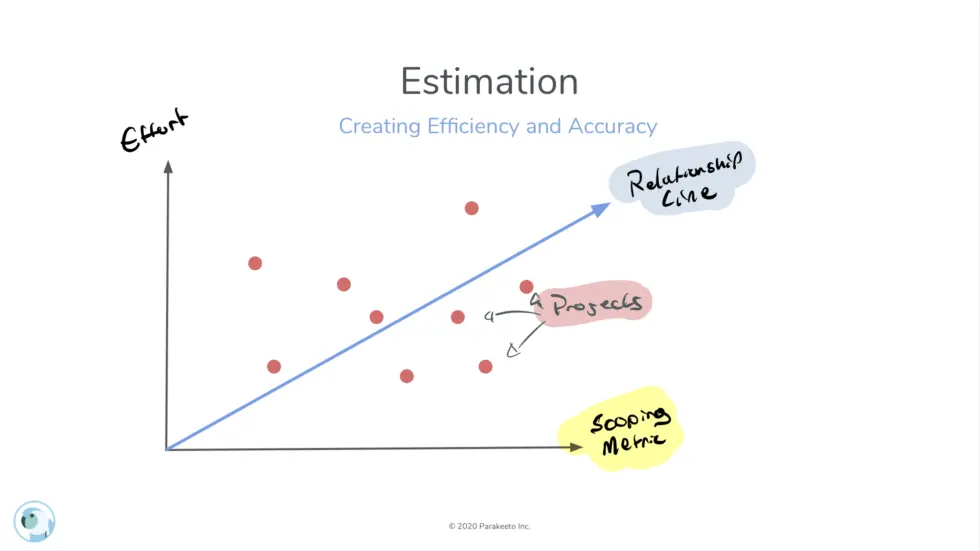
- Ask yourself, “if the client needs more _____ , then effort will increase by ________.” For example, if the client needs two more web pages, it’s going to take six more hours of freelancer time. Then, add on your margin.
- Simplifying Data Structures and Reducing Complexity
- Ask yourself, “What’s the sequence of questions I go through when a project goes wrong?”
- Do you focus on the phase or step in the process that went awry? Or are you more focused on people or departments?
- Ask yourself, “What’s the sequence of questions I go through when a project goes wrong?”
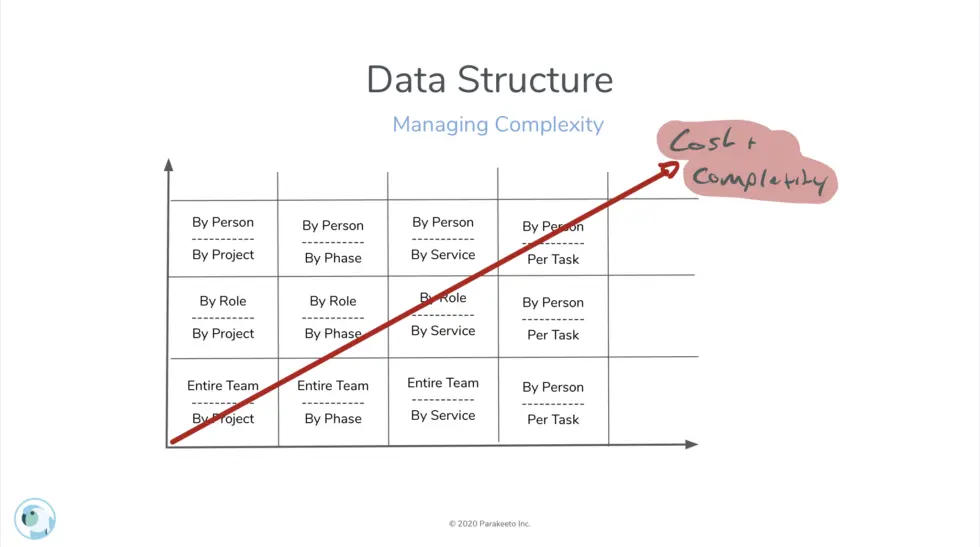
For most agencies, this is going to be some kind of a skill-based or role-based grouping.
The end goal of this exercise should be to come up with a standardized method and structure for estimating different types of work.
For example, for clients looking for a website project, we ask five standard questions during discovery (every time) to make sure we have a sense of the scale.
And we structure the estimate using the following objects:
- Client
- Project
- Phases (workshop, wireframing, copy, design, development)
- Roles (project manager, designer, writer, developer, strategist)
- Phases (workshop, wireframing, copy, design, development)
- Project
The end goal of this is to be able to create a similar structure for estimates so you can begin comparing objects to one another over time. For example, you might want to ask the question:
What is the average amount of design time required for the wireframing phase of a website project?
If your data has been structured to answer that question on the last five website projects, you’re now equipped to answer that question so long as the way you set up your time tracking or project management tool matches that hierarchy.
Step two: installing quantitative feedback loops (time & cost tracking)
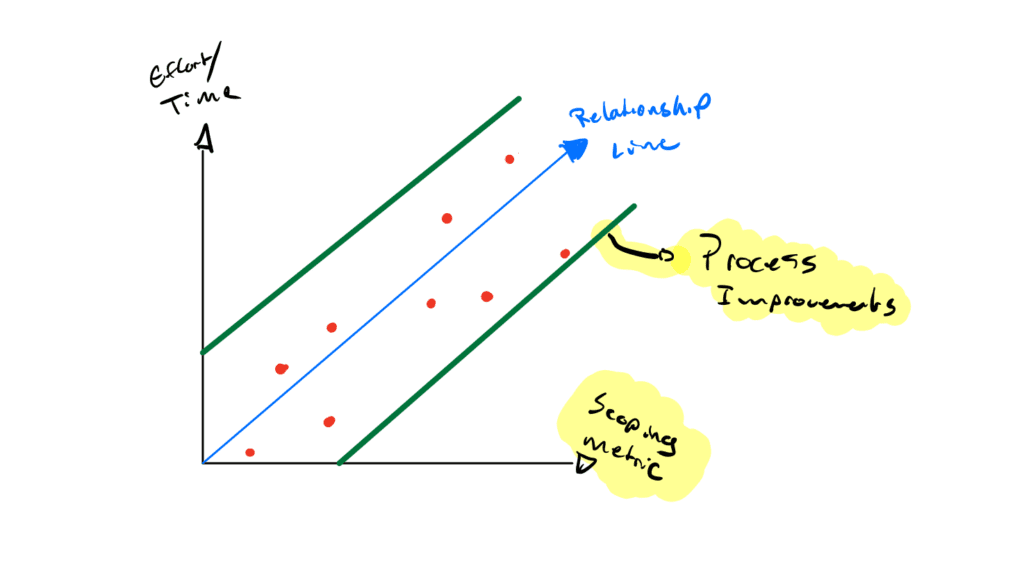
Now that we’ve defined and standardized our process, we make it easy to install a feedback loop that places data points on the graph below, slowly building that relationship line that only strengthens with time.
However, it’s not all butterflies and rainbows, yet. What we’ve seen in the past, is that this data can be skewed by the ever-illusive “time tracking” issue. Here are two main problems we see:
1. Clashing project management and operational structures
The most common example we see is of this disconnected is when estimates are broken down by function or role (created by the ops team):
“x hours of development, xx hours of design, xx hours of project management, etc.”
Whereas the project management philosophy is more aligned with tasks:
"X hours on the content outline, XX hours on the wireframes, XX hours on Q/A, etc."
This problem is exacerbated by the fact that most agencies use time tracking tools, of which projects are structured in a certain way, and therefore it’s more difficult to solve these issues. But, the tool itself doesn’t come without fault as well.
We typically see issues with the naming conventions your agency is used to. In one project, you may name design “web design” and in another project, you may name it “designer”. Heck, in a third project you may name them “graphic designer”, all of which are the same role but are called different things, and therefore do not give us horizontally consistent data across different projects (to compare, analyze and make decisions).
2. Lacking proper tooling for project management, time and cost-tracking
Once you’ve decided on a consistent structure for your data with horizontally aligned naming conventions, you know exactly what you need from your project management tool to implement this. But not each tool will be a “fit” for you.
Do your research, discover if that tool will allow the level of complexity of your structures, and find that sweet spot. Industry leaders that we see from clients all the time include ClickUp, Monday.com, Asana and Teamwork.
Then, choose a time-tracking tool. It doesn’t need to be an all-in-one tool (for time tracking AND project management), and from our experience, those tools are extremely mediocre and end up leaving out useful or key features that you’d get from a single, specialized tool. Doing so will allow your ops and PM team to work without compromises.
If you are going to use time tracking that is integrated with a project management tool, just make sure you can use tags, custom fields or naming conventions to map every time entry back to the SAME FORMAT you’re using on your estimates. Without this your time tracking data will be essentially worthless when it comes to driving future estimates.
Wait a second, what if my team hates tracking time?
We know. We don’t love doing it either, but we all know how important this information is.
Here are two essential elements to accurate, reliable, actionable time tracking data:
- Compliance
- Honesty
Getting the team on board with time tracking is more than just a 30 minute meeting going through how to do it. The culture at your agency must promote the importance of time-tracking as a critical component in measuring performance and profitability.
The team must also understand how important it is to be truthful and transparent about their time spent, not because you don’t trust them, but because of how it impacts decision making.
Never use time tracking data to discipline or police people. Don’t use it to measure productivity. Only ever use it to facilitate discussions about how and why things didn’t go the way you assumed they would when it was scoped, and find opportunities to get more efficient.
Recommended Reading: How to Think More Profitably as an Agency Owner | Marcel Petitpas
Step three: data-driven conversations with the team
Finally, we’re in a place where we can talk about data, and how to use it in your estimation system.
You’re going to want to meet with your team to uncover the context behind projects that go much better or worse than expected.
The best way to do this is through project performance meetings or project retrospectives (the only difference between these is that retros are at the end of projects, whereas performance meetings are on a fixed cadence [ie. weekly or monthly]).
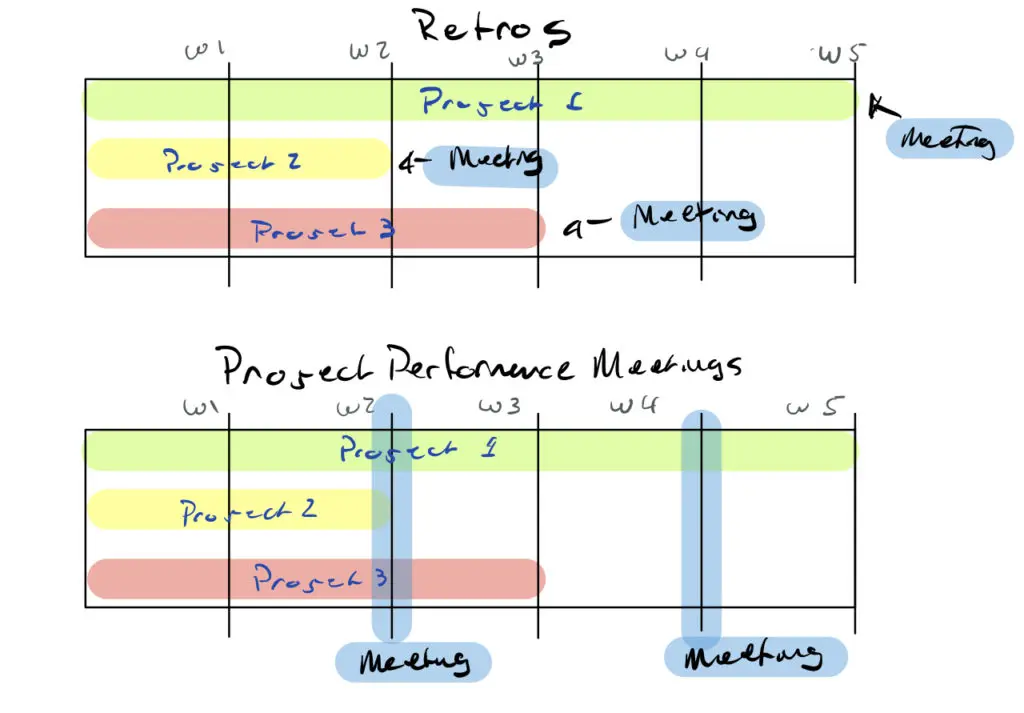
Here are your goals/topics for these meetings:
- Compare estimates vs actuals for all projects
- Where things ARE and ARE NOT going to plan (and why?)
- Draw out ideas from the team about opportunities for improving a process or scoping
- Translate decisions into action items and engage the team in implementing them
Now, how can you best approach talking about what went wrong? It’s so much easier to chat about the success of a promptly executed project within budget…not so much the opposite.
Here are two tips when it comes to making these meetings successful (and not dreaded by the team!):
- Focus on the process, not the people
- Rarely will you see a person fail miserably with a well-thought-out process as their foundation. So, instead of approaching a project that went over budget like this:
“Tim, you spent twice as much time on project management during this project as was budgeted, why is that?”
Say this:
“It looks like our estimate on project management was off by about half. Any ideas on what may have caused that gap?”
- Rarely will you see a person fail miserably with a well-thought-out process as their foundation. So, instead of approaching a project that went over budget like this:
- Drive the meeting, but don’t steal the spotlight!
- It’s important to take a bit of a backseat in this conversation, and just chime in when the team gets stuck. After all, you likely weren’t in the trenches to see exactly how it was playing out. Or, even if you were, it’s important that your team feels the ownership for these projects that greatly increases the likelihood of a successful process iteration down the road. Don’t worry, they’ve got it!
- Make it a priority - not an optional add on!
- It’s important that you also show the team how integral their feedback is to process improvement. That means sticking to your promise and implementing these as part of the project rather than an optional call (that is likely to be bumped if you’ve got a busy week).
Bonus: By the way, as you implement these project estimation improvements, you should see timelines become much more reliable (so you won’t need to ditch the retro!)
Step four: process improvement cycles
Finally, we’re taking what we’ve got and turning it into process improvements. These improvements will lead to more consistency in our time investments for work, which become easier and easier to predict the more you do it. You’ll see the relationship line in your estimation becomes stronger and it’s actually pushed towards a more significant relationship as process improvements come (see image below).
We start with two frameworks:
- Delivery processes
- Project estimation techniques
Delivery processes - iteration
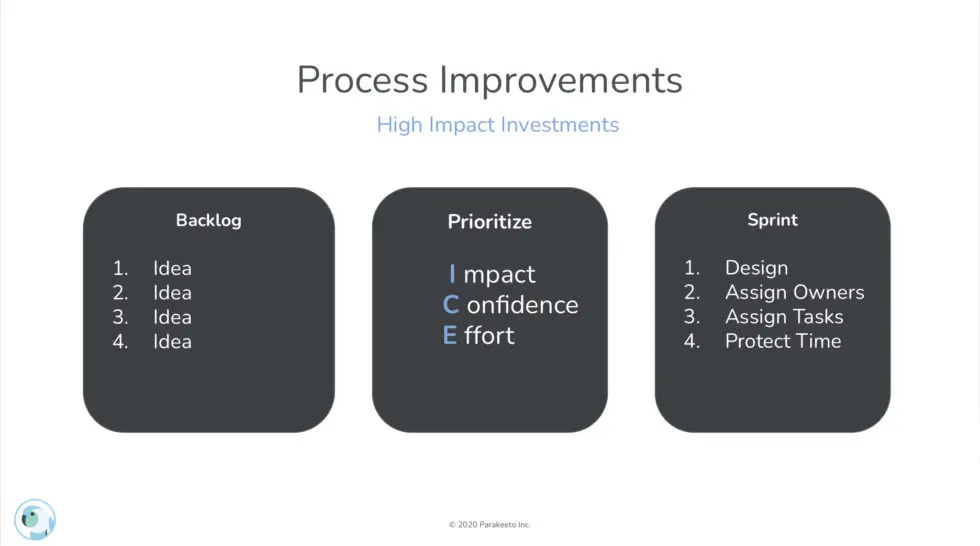
First, you can start by defining the framework we use to make iterations on our processes. Our team likes to create a backlog of improvements that can be made (usually these action items come out of retro and performance meetings) and then tackle them in sprints. In doing so, our processes improve, but that doesn’t mean we stop adding to the backlog. The backlog is a never-ending cycle of improvement. There is always room for it.
Bonus - we use the I.C.E. score to prioritize our backlog. It helps us decide what can wait and combines it with what has the greatest impact relative to the effort involved in implementing it.
Project estimation techniques - iteration
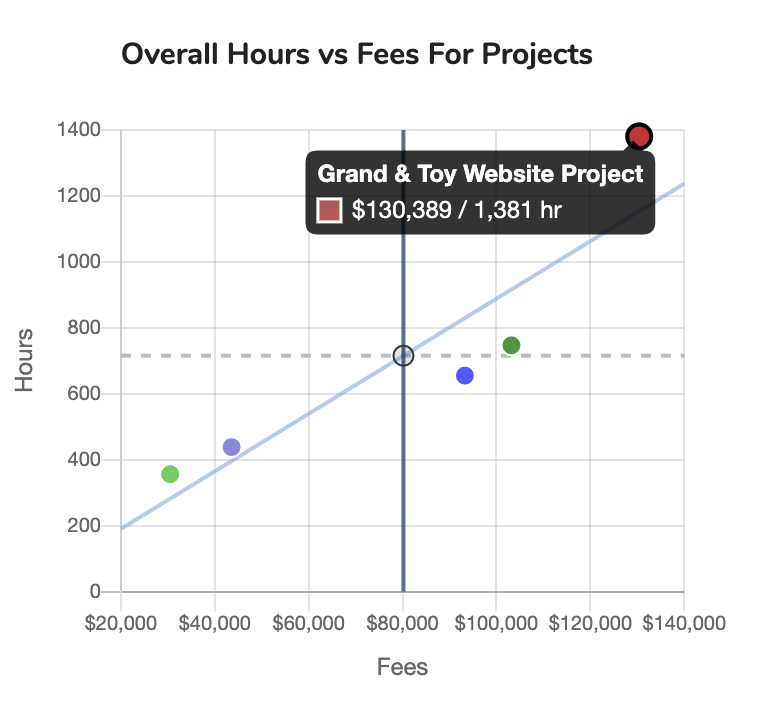
Lastly, it’s important to revisit your estimation techniques regularly. We’re going to want to take the data you’ve gained from previous projects including cost & time tracking and then map it against your scoping metrics.
You can build a full library of projects and group them (or tag them) by size, scope, service, etc. Ideally, the relationship line will become stronger and stronger, making your estimations more reliable as time goes on.
The end result should be the ability to take those scoping questions we discussed at the start of the post and plug them into a model that uses data to help you predict the time it will take to complete.
For example:
The client needs a website with 30 pages, a custom eCommerce widget, an email marketing integration, and has about a $50,000 budget
Based on that information, we think they’re about a 5/10 on our website complexity scale (from the most to the least complex we’ve worked on)
Based on past projects, we should be estimating around:
- 32 project management hours
- 65 design hours
- 60 development hours
- 18 quality assurance hours
All that’s left to do is apply that last 10 percent of judgment and start modeling different price scenarios to make sure your margins are in the right place.
Project profitability targets
The last question we should spend a moment answering before we wrap is how profitable a project should be?
Of course there is nuance here, but assuming you’re in a position to have the client walk away without your utilization rates absolutely tanking, you should be aiming for 60-70 percent plus Delivery Margin.
What does that mean?
In short - the amount it will cost you to complete the project will be 30-40 percent of the Agency Gross Income (AGI) you’ll bring in from the project.
Here’s the Formula:
Delivery Margin = (Agency Gross Income (AGI - Cost)/Cost
Definitions:
Agency Gross Income (AGI) is the amount of revenue left over after subtracting pass-through expenses such as advertising spend, print budgets, external vendors/partners, material costs, etc.
Delivery Costs are the direct costs related to getting the deliverable done, and most often is just the cost of your team’s time as well as any freelancers you’re bringing in to do the work.
For full-time employees, hourly cost is calculated by taking their annual salary plus benefits and dividing it by 2080 hours.
Read more about the details of calculating cost-per-hour and calculating profit margins.
Example:
Total project fees: $15,000
Pass-through expenses: $5,000
AGI: $10,000
Cost: 100 hours x average cost of $25/hr = $2500
Delivery Margin = ($10,000 - $2,500) / $10,000 or 75 percent
Pro Tip:
If you know your average cost per hour, you can quickly get a read on your Delivery Margin by calculating your ABR, and plugging that into a Delivery Margin calculation.
Example:
Project AGI: $10,000
Estimated hours: 100
Average cost per hour = $35/hr
Average Billable Rate = $10,000 / 100 = $100/hr
Estimated Delivery Margin = ($100 - $35) / $100 = 65 percent
Closing Thoughts
A good system for project estimation can make or break your agency. It keeps your team happy, your clients satisfied and your agency profitable. It can allow you to quickly and easily predict project profitability and better plan your people and hiring plans.
Investments in estimation and clean data aren’t sexy, but they are the foundation for your agency operations systems. A few moments applying a bit more structure to your estimation & pricing process today can mean a lot of upside for many years to come.
Copy this totally free framework including the flywheel in our Agency Profit Toolkit.

